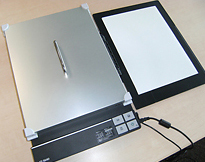
The FPD-8010E converts Prescale pressure values into numerical data and is a pressure mapping analysis system that allows various methods of analysis. In order to make Prescale data even more useful, it will meet your requirements for converting to numerical data, saving data and performing data analysis.
Functions (Prescale)
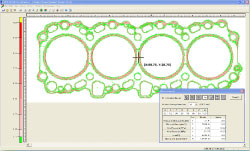
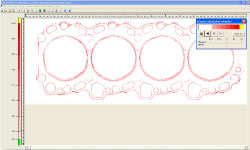
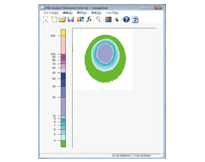
Overall Measurement
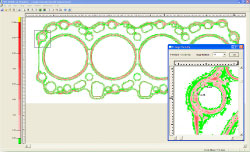
Partial Enlargement
Various data such as average pressure and maximum pressure are displayed
The specified field is enlarged (x4,x8,x16). Pin point pressure values can be displayed on the image
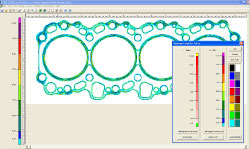
Changing The Pressure Bar Setting
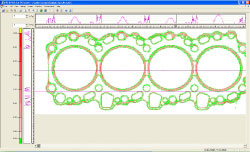
Pressure Cross Section
The coloured pressure bar and the pressure bar boundary can be changed
Pressure distribution on a line passing through a specified point is shown on a line graph
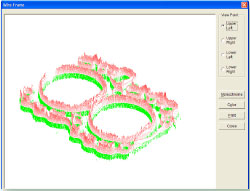
Wire Frame
Pressure Distribution Animation
Pressure is displayed in 3-D format
Step-by-step pressure values are displayed in an animated format
Text Data Output
Pressure Distribution Animation
Pressure data is exported to a text file
The upper and left segments of the total pressure are displayed on a bar graph
Histogram Analysis
Printing and Saving
Pressure on the circumference is displayed as a histogram
The displayed screen and data can be printed. After stored data is re-loaded and displayed, you can store it
Product Name
FUJIFILM PRESSURE DISTRIBUTION MAPPING SYSTEM for PRESCALE
Model
FPD-8010E
Main Functions
Prescale image input function Pressure distribution display function/ Pressure data output function 3D display function / polar coordinate display function
Scan Sizes
Single Read : 297mm × 210mm (11.7 in × 41.3 in) Maximum : 891mm × 1050mm (35.1 in × 41.3 in)
Please ask us for information on recommended scanner types
UVSCALE software
The FUD-7010E analysis software converts UVSCALE density values into UV light amount
Analysis system measurement features
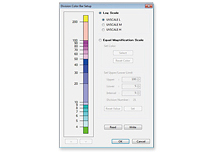
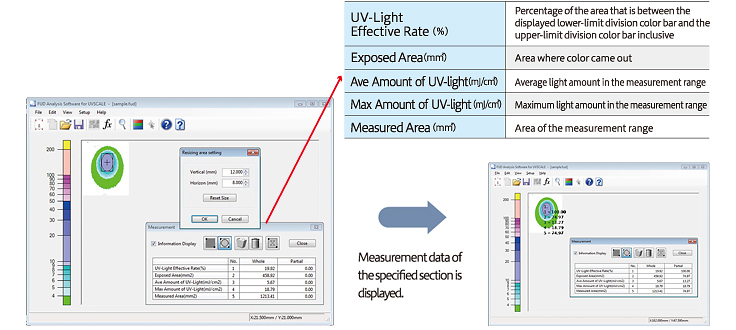
Division Colour Bar Setup
Light amounts measured are illustrated in a graph by colours. Various settings, such as scale type (log scale, equal magnification scale), upper and lower limits of scale bars, intervals, and colour, can be freely set based on measurement condition
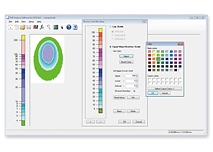
Measuring light amount
Data imported is converted into numerical values. Measurement data of the entire section and section specified with a rectangle or circle is displayed
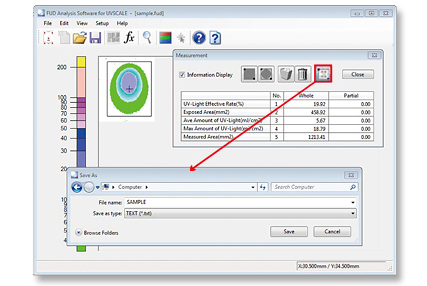
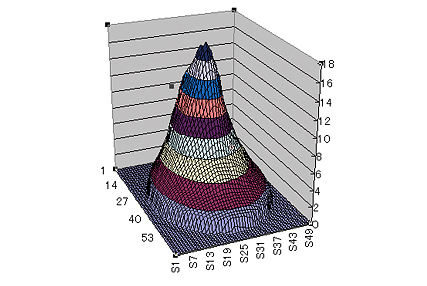
Rectangular Area Data Export Function
Results of partial measurement (rectangle) can be output in text data. Using Excel to graph the results—as shown on the right—makes it possible to see the light amount distribution in a way that is easy to understand.
How to use an analysis system
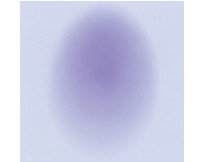
Irradiate light to a UV-SCALE
2) Set UV-SCALE on the scanner (recommended model) and scan the colour sample
3) Analyse it on a PC in which the exclusive software has been installed
Calibration
Use a calibration sheet to correct variations caused by difference in scanners and conditions as much as possible and to stabalise measurement results
Setting measurement conditions
Select UVSCALE type used, light source lamp, and sample name to be saved on the new creation screen
Correction Value Setting
Entering a correction value can correct differences in light amount values caused by differences in illuminometers, temperature, and other measurement conditions to obtain an appropriate value.
Specifications
Product Name
FUJIFILM UV LIGHT DISTRIBUTION MAPPING SYSTEM for UVSCALE